On a scale from 1 to 10 how good are your data warehousing skills? Want to go above 7/10? This article is for you then. How good is your SQL? Want to get ready for a job interview asap? 
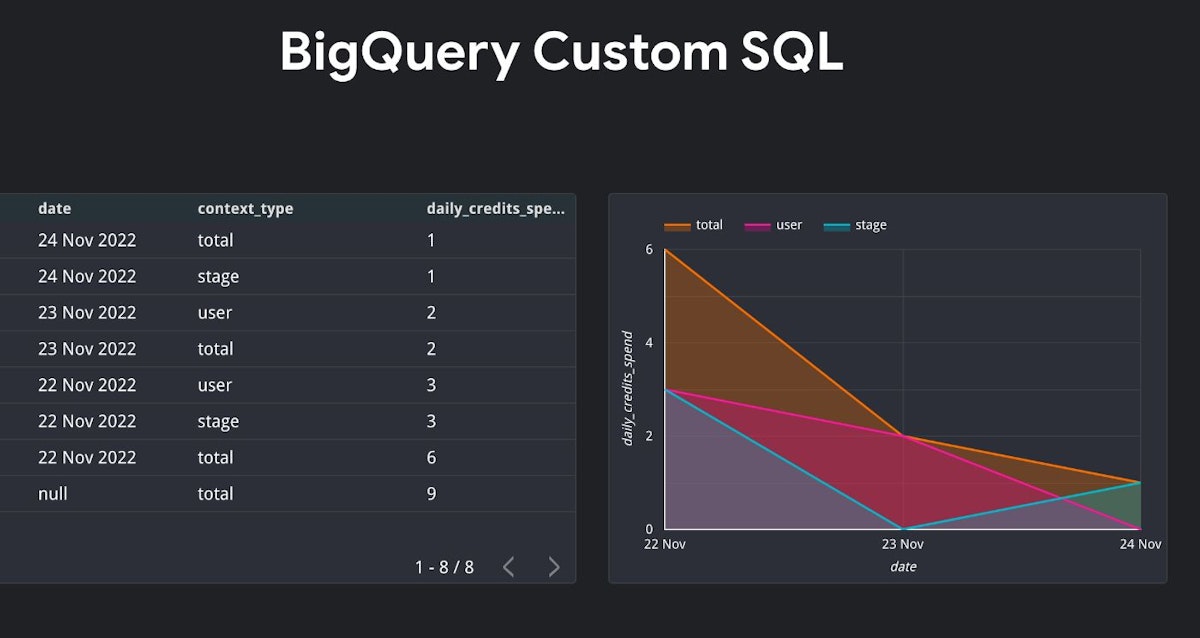
This blog post explains the most intricate data warehouse SQL techniques in detail. I will use BigQuery standard SQL dialect to scribble down a few thoughts on this topic. 1. Incremental tables and MERGE Updating table is important. It is important indeed. Ideal situation is when you have transactions that are a PRIMARY key, unique integers and auto increment. Table update in this case is simple: https://gist.github.com/mshakhomirov/18775cbbe8288af864ad79247c0de63d?embedable=true#file-1-1-sql That is not always the case when working with denormalized star-schema datasets in modern data warehouses. you might be tasked to create with SQL and/or incrementally update datasets with just a portion of data. might not exist but instead you will have to deal with data model where unique key depends on the latest (or timestamp) known. For example, in dataset depends on the latest known connection timestamp. In this case you would want to existing users and the new ones. sessions transaction_id transaction_id user_id last_online update insert MERGE and incremental updates You can use or you can split the operation into two actions. One to update existing records with new ones and one to insert completely new ones that don't exits (LEFT JOIN situation). MERGE is a statement that is generally used in relational databases. Google BigQuery MERGE Command is one of the Data Manipulation Language (DML) statements. It is often used to perform three main functions atomically in one single statement. These functions are UPDATE, INSERT, and DELETE. MERGE UPDATE or DELETE clause can be used when two or more data match. INSERT clause can be used when two or more data are different and do not match. The UPDATE or DELETE clause can also be used when the given data does not match the source. This means that the Google BigQuery MERGE Command enables you to merge Google BigQuery data by updating, inserting, and deleting data from your Google BigQuery tables. Consider this SQL: https://gist.github.com/mshakhomirov/5ad1a7518c54bc030d1c78b56fe3cf82?embedable=true#file-1-2-sql 2. Counting words Doing UNNEST() and check if the word you need is in the list you need migth be useful in many situation, i.e. data warehouse sentiment analysis: https://gist.github.com/mshakhomirov/694e040539b0d1b556f8e053d315a3bf?embedable=true#file-2-sql 3. Using IF() statement outside of the SELECT statement This gives us an opportunity to save some lines of code and be more eloquent code-wise. Normally you would want to put this into a sub-query, and add a filter in the clause but you can do instead: where this https://gist.github.com/mshakhomirov/933e6a358e49dcccd4e547a5509c8fda?embedable=true#file-3-sql Another example how to use it with tables. . This is bad example because since the matching table suffixes are probably determined dynamically (based on something in your table) you NOT partitioned Don't do this will be charged for a full table scan. https://gist.github.com/mshakhomirov/1c62d79cd9690140c569cd047b9d491f?embedable=true#file-3-2-sql You can also use it in clause and functions. HAVING AGGREGATE 4. Using GROUP BY ROLLUP The ROLLUP function is used to perform aggregation at multiple levels. This is useful when you have to work with dimension graphs. The following query returns the total credit spend per day by the transaction type (is_gift) specified in the clause, and it also shows the total spend for each day and the total spend in all the dates available. where https://gist.github.com/mshakhomirov/4cf738aaad967fe92c4fb7192874fadf?embedable=true#file-4-sql 5. Convert table to JSON Imagine you are required to convert your table into JSON object where each record is an element of nested array. This is where function becomes useful: to_json_string() https://gist.github.com/mshakhomirov/aac1f93312ae305ba80c915fe4a2a386?embedable=true#file-5-sql Then you can use it anywhere: dates, marketing funnels, indices, histogram graphs, etc. 6. Using PARTITION BY Given , and columns. For EACH date, how do you show the total revenue value for EACH customer while keeping all the rows? You can achieve this like so: user_id date total_cost https://gist.github.com/mshakhomirov/e4f11721eb5a3182150df08f25b70d64?embedable=true#file-6-sql 7. Moving average Very often BI developers are tasked to add a moving average to their reports and fantastic dashboards. This might be 7, 14, 30 day/month or even year MA line graph. So how do we do it? https://gist.github.com/mshakhomirov/ebf5488d0036bc9b84ae05889346d986?embedable=true#file-7-sql 8. Date arrays Becomes really handy when you work with or want to check some dataset for missing values, i.e. dates. BigQuery has a function called : user retention GENERATE_DATE_ARRAY https://gist.github.com/mshakhomirov/2ba5a67053f85794462dab98e56ad74d?embedable=true#file-8-sql 9. Row_number() This is useful to get something latest from your data, i.e. latest updated record, etc. or even to remove duplicates: https://gist.github.com/mshakhomirov/05d0c04c5975207d98552ffd436add8b?embedable=true#file-9-sql 10. NTILE() Another numbering function. Really useful to monitor things like if you have a mobile app. For example, I have my App connected to Firebase and when users I can see how long it took for them. Login duration in seconds login This function divides the rows into buckets based on row ordering and returns the 1-based bucket number that is assigned to each row. The number of rows in the buckets can differ by at most 1. The remainder values (the remainder of number of rows divided by buckets) are distributed one for each bucket, starting with bucket 1. If evaluates to NULL, 0 or negative, an error is provided. constant_integer_expression constant_integer_expression https://gist.github.com/mshakhomirov/16fe941aa8c4ed79e4aad8b7049b307a?embedable=true#file-10-sql 11. Rank / dense_rank They are also called functions. I tend to use as it doesn't skip the next available ranking whereas would. It returns consecutive rank values. You can use it with a partition which divides the results into distinct buckets. Rows in each partition receive the same ranks if they have the same values. numbering DENSE_RANK as default ranking function RANK Example: https://gist.github.com/mshakhomirov/459b68c5f3d1e8284c01e516db1d8dcb?embedable=true#file-11-1-sql Another example with product prices: https://gist.github.com/mshakhomirov/4c90a6fc8516d8264e172676a83a1048?embedable=true#file-11-2-sql 12. Pivot / unpivot Pivot changes rows to columns. It's all it does. Unpivot does the . opposite https://gist.github.com/mshakhomirov/f90b035ba259e672d4d51a669e0cd1fc?embedable=true#file-12-sql 13. First_value / last_value That's another useful function which helps to get a delta for each row against the first / last value in that particular partition. https://gist.github.com/mshakhomirov/ea4de9144b97bf8c196cab07609c309e?embedable=true#file-13-sql 14. Convert a table into Array of structs and pass them to UDF This is useful when you need to apply a user defined function (UDF) with some complex logic to each row or a table. You can always consider your table as an array of TYPE STRUCT objects and then pass each one of them to UDF. It depends on your logic. For example, I use it to calculate purchase expire times: https://gist.github.com/mshakhomirov/35d956fa9db86b12b44ab62c00f42a40?embedable=true#file-14-sql In a similar way you can create tables with no need to use . For example, I use it to mock some test data for unit tests. This way you can do it very fast just by using + + in your editor. UNION ALL Alt Shift Down https://gist.github.com/mshakhomirov/6ea226c1b5b789d4a31691ce065c20d7?embedable=true#file-14-2-sql 15. Creating event funnels using FOLLOWING AND UNBOUNDED FOLLOWING Good example might be marketing funnels. Your dataset might contain continiously repeating events of the same type but ideally you would want to chain each event with next one of a different type. This might be useful when you need to get a list of something, i.e. events, purchases, etc. in order to build a funnels dataset. Working with PARTITION BY it gives you the opportunity to group all the follwoing events no matter how many of them exists ineach partition. https://gist.github.com/mshakhomirov/05fd7d79d8acf3b173181a5d950ab6e7?embedable=true#file-15-sql 16. Regexp You would to use it if you need to extract something from unstructured data, i.e. fx rates, custom groupings, etc. Working with currency exchange rates using regexp Consider this example with exchange rates data: https://gist.github.com/mshakhomirov/9ca6e153da19c491034bd57995875308?embedable=true#file-16-1-sql Working with App versions using regexp Sometimes you might want to use to get , or versions for your app and a create a custom report: regexp major release mod https://gist.github.com/mshakhomirov/b1f442a296ffef52c7baa1245e1dc316?embedable=true#file-16-2-sql Conclusion SQL is a powerful tool that helps to manipulate data. Hopefuly these SQL use cases from digital marketing will be useful for you. It's a handy skill indeed and can help you with many projects. These SQL snippets made my life a lot easier and I use at work alomost every day. More, SQL and modern data warehouses are essentials tools for data science. Its robust dialect features allow to model and visualize data with ease. Because SQL is the language that data warehouses and business intelligence professionals use, it's an excellent selection if you want to share data with them. It is the most common way to communicate with almost every data warehouse / lake solution in the market. Originally published in by mydataschool.com datamike Mike is a passionate and digitally focussed individual with an abundance of drive and enthusiasm, loving the challenges the full mix of digital marketing throws up. Lives in the UK, completed MBA from Newcastle University in 2015.